This document provides basic statistics about the topology of the Web Data Commons - Hyperlink Graph extracted from the 2012 Common Crawl Corpus covering 3.5 billion web pages and 128 billion hyperlinks between these pages.
We analyze the page-level graph as well as a pay-level-domain aggregation of the graph.
Contents
1. Page Graph
The page graph consists of over 3.5 billion nodes and over 128 billion arcs between those nodes. In the following we will report about the basic findings within the page graph. A more detailed analysis can be found in: Graph Structure in the Web - Revisited by Robert Meusel, Sebastiano Vigna, Oliver Lehmberg, Christian Bizer, an accepted paper at the 23rd International World Wide Web Conference (WWW2014), Web Science Track, Seoul, Korea, April 2014
1.1 Indegree and Outdegree Distribution
The following two figures show frequency plots of indegrees
and outdegrees in log-log scale. For each d, we plot a point with
an ordinate equal to the number of pages with that have degree d. Note that
we included the data for degree zero, which is omitted in most of the
literature. We then aggregate the values using Fibonacci
binning to show the approximate shape of the distribution.
We find the page with the highest indegree to be referenced by of 95 million other pages and
the page with the largest number of links to contain almost 56 thousand references to other pages.
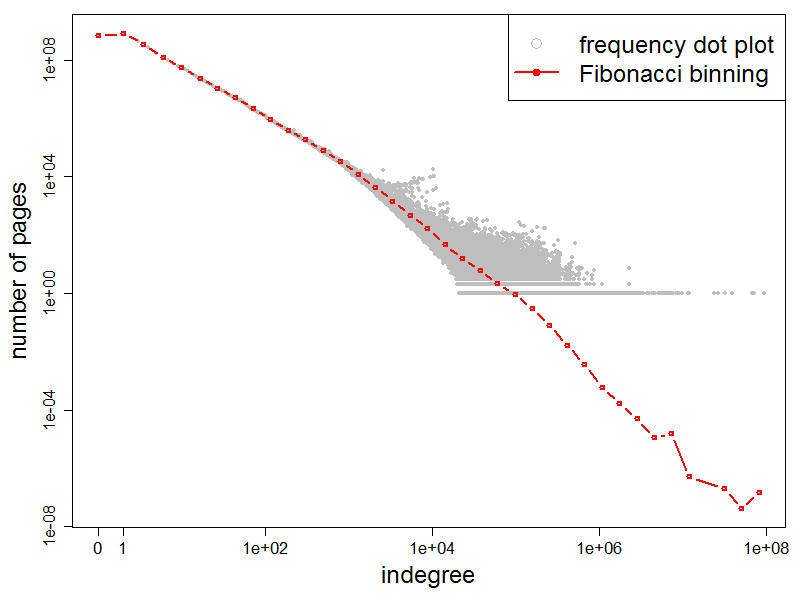 Frequency plot of the indegree distribution |
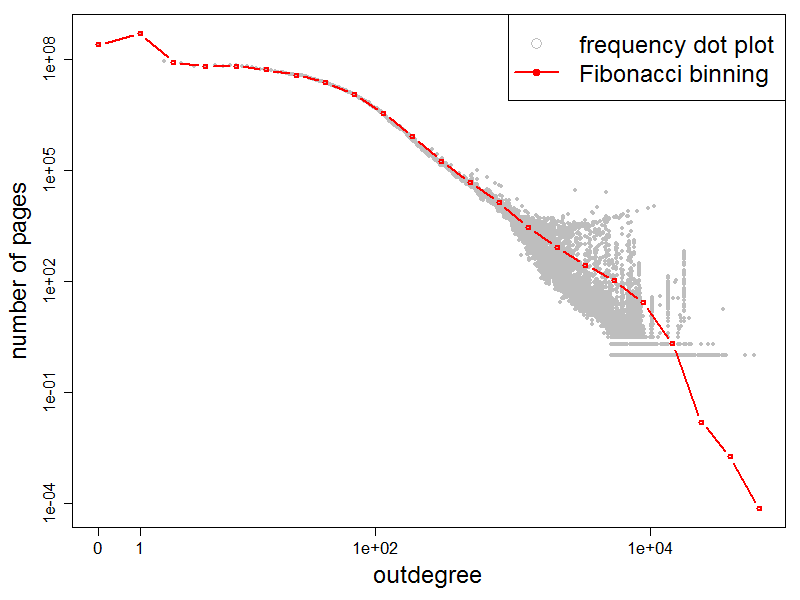 Frequency plot of the outdegree distribution |
1.2 Connected Components
The following figure (left) shows the distribution of the sizes of the
weakly connected components using a visualization similar to the previous
figures. The largest component (rightmost grey point) contains about around 94% of
the whole graph (over 3.34 billion pages).
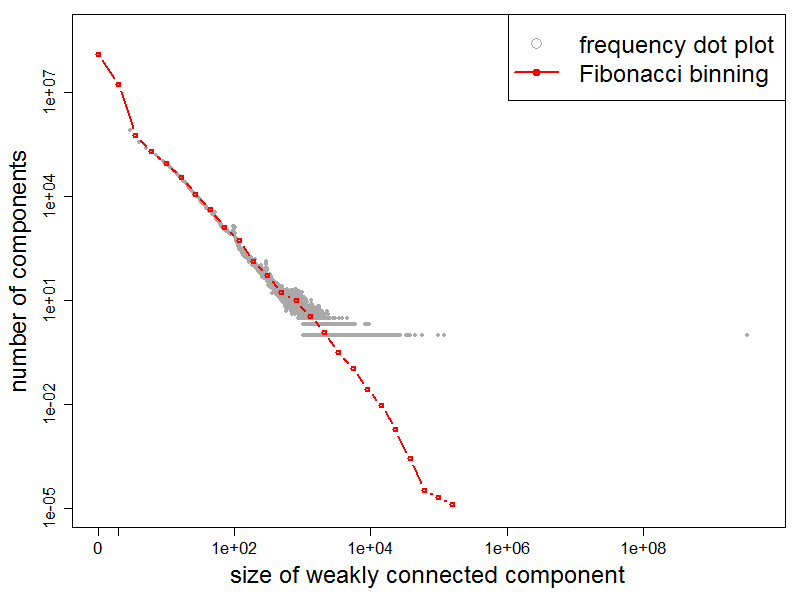
Frequency plot of the distribution of WCCs
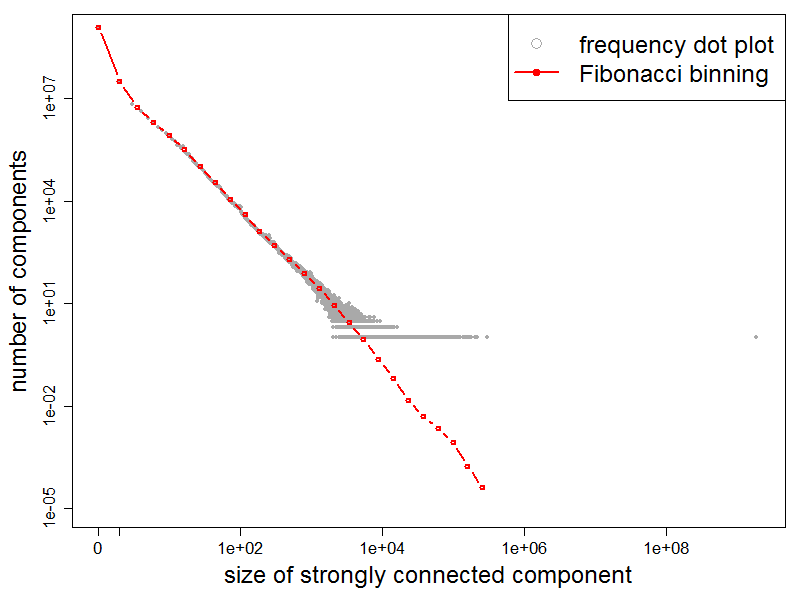
Frequency plot of the distribution of SCCs
1.3 Bow-Tie Structure
Having identified the giant strongly connected component, we can determine the so-called bow tie, a depiction of the structure of the web suggested by Broder et al.. The bow tie is made of six different components:
- the core is given by the giant strongly connected component (LSCC);
- the IN component contains non-core pages that can reach the core via a directed path;
- the OUT component contains non-core pages that can be reached from the core;
- the TUBES are formed by non-core pages reachable from IN and that can reach OUT;
- pages reachable from IN, or that can reach OUT, but are not listed above, are called TENDRILS;
- the remaining pages are DISCONNECTED.
x to y if some node in the
component associated with x is connected with a node in the component associated with y.
The bow tie of the page graph is shown in the following figure:
Bow-Tie Structure of the Page Graph
2. Pay-Level-Domain Graph
The PLD Graph is created from the Page Graph by aggregating all pages that belong to a pay-level-domain (PLD) into a single node. For example, the pay-level-domain of dws.informatik.uni-mannheim.de is uni-mannheim.de. All pages under one PLD are aggregated into one node and all internal links are removed. External links, i.e. those leading to other PLDs, are kept, but only once.
The PLD graph consists of over 43 million websites/nodes and over 623 million distinct arcs between those nodes.
2.1 Weakly and Strongly Connected Components
The PLD graph contains one giant weakly connected component that consists of 39.4 million nodes (92%). The following diagrams show the distribution of the weakly connected components (WCC) and the strongly connected components (SCC) in the PLD graph. The x-axis charts the size of the components and the y-axis draws the number of components for a particular size. Both axes are log-scaled. The respective distribution is marked by the blue dots and the calculated power law distributions are shown as black lines. The distribution of the sizes of WCCs follows a power law with an exponent of 1.411. The power law is calculated excluding the giant component.
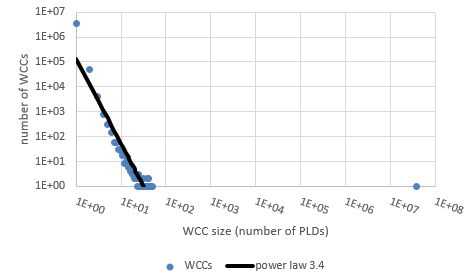 Distribution of the Weakly Connected Components (PLD-Level) |
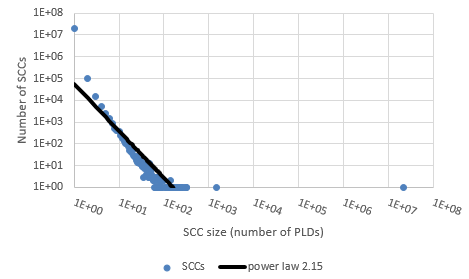 Distribution of the Strongly Connected Components (PLD-Level) |
2.2 In- and Out-Degree Distribution
The following diagrams show the in- and out-degree distributions of the PLD graph. The respective distribution is marked by the blue dots and the calculated power law distributions are shown as black lines. Both distributions follow a power law, where the exponent for in-degree is 1.56 and the exponent for the out-degree distribution is 1.49.
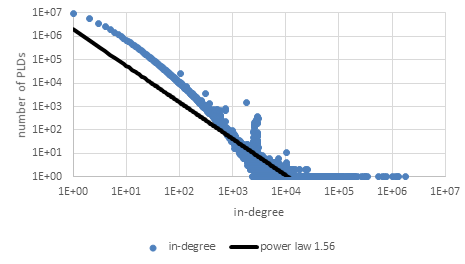 In-Degree Distribution (PLD-Level) |
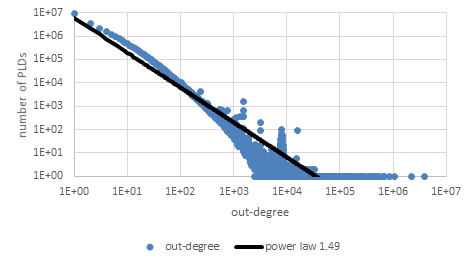 Out-Degree Distribution (PLD-Level) |
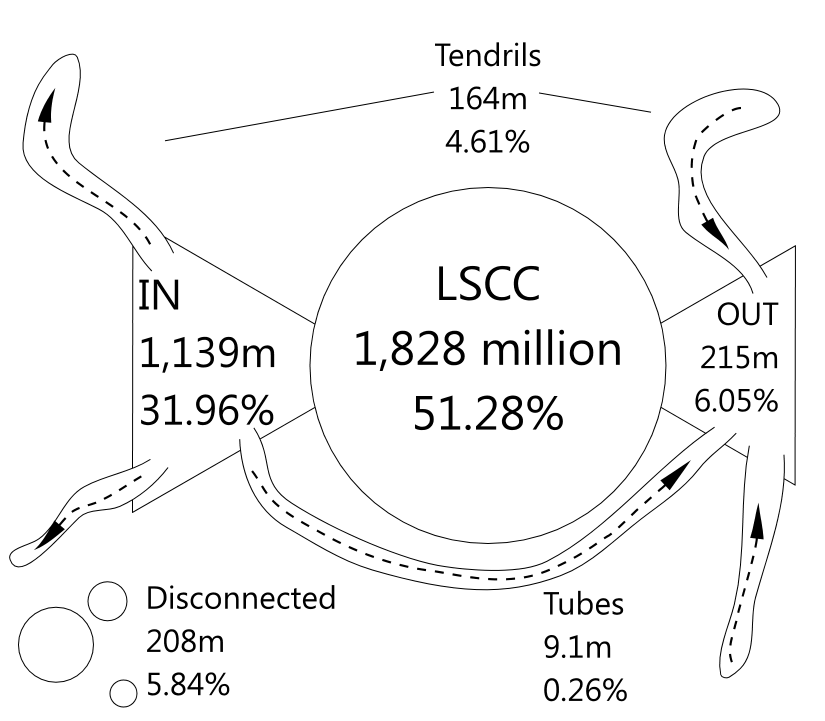
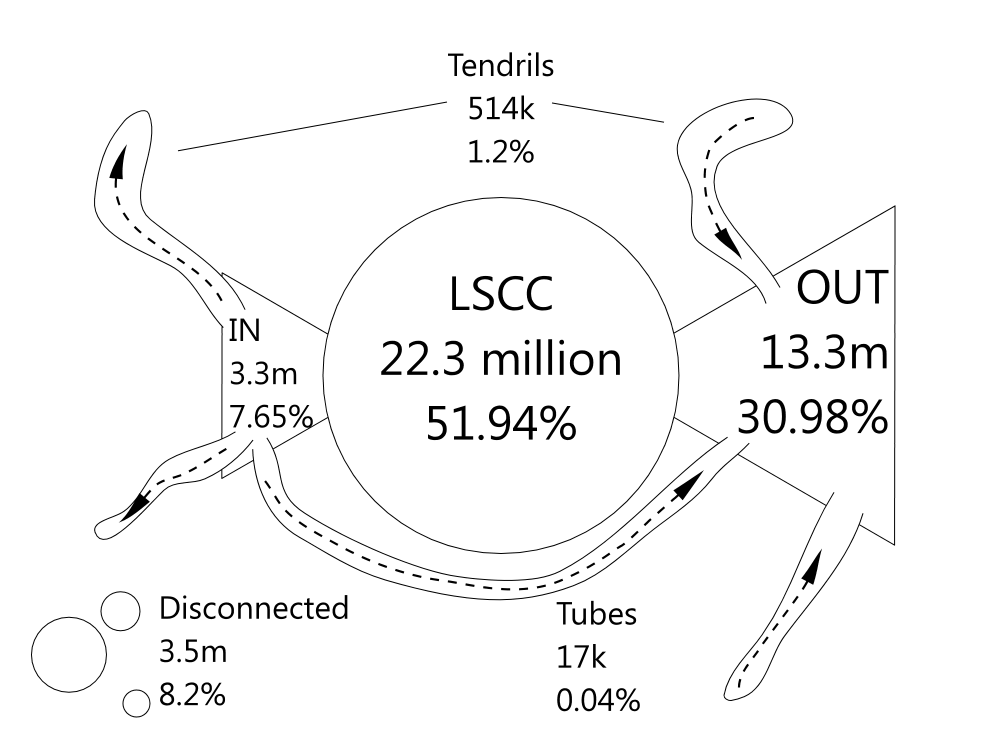
2.3 Bow-Tie
We further determine the Bow-Tie structure of the PLD Graph. The Bow-Tie structure consists of the largest strongly connected component (LSCC) that is flanked by two other components, IN and OUT. The IN component contains all nodes that are not part of the LSCC, but are connected to it via a directed path. Similarly, the OUT component contains nodes that are, via a directed path, reachable from the LSSC. Connected to the IN and OUT component, there are TENDRILS that lead away from the IN or towards the OUT component respectively. If two such TENDRILS are connected, they form TUBES. The TUBES component contains nodes that directly connect the IN and OUT components, without going through the LSCC. All remaining nodes, i.e. those that are not part of the largest weakly connected component, belong to the DISCONNECTED component.
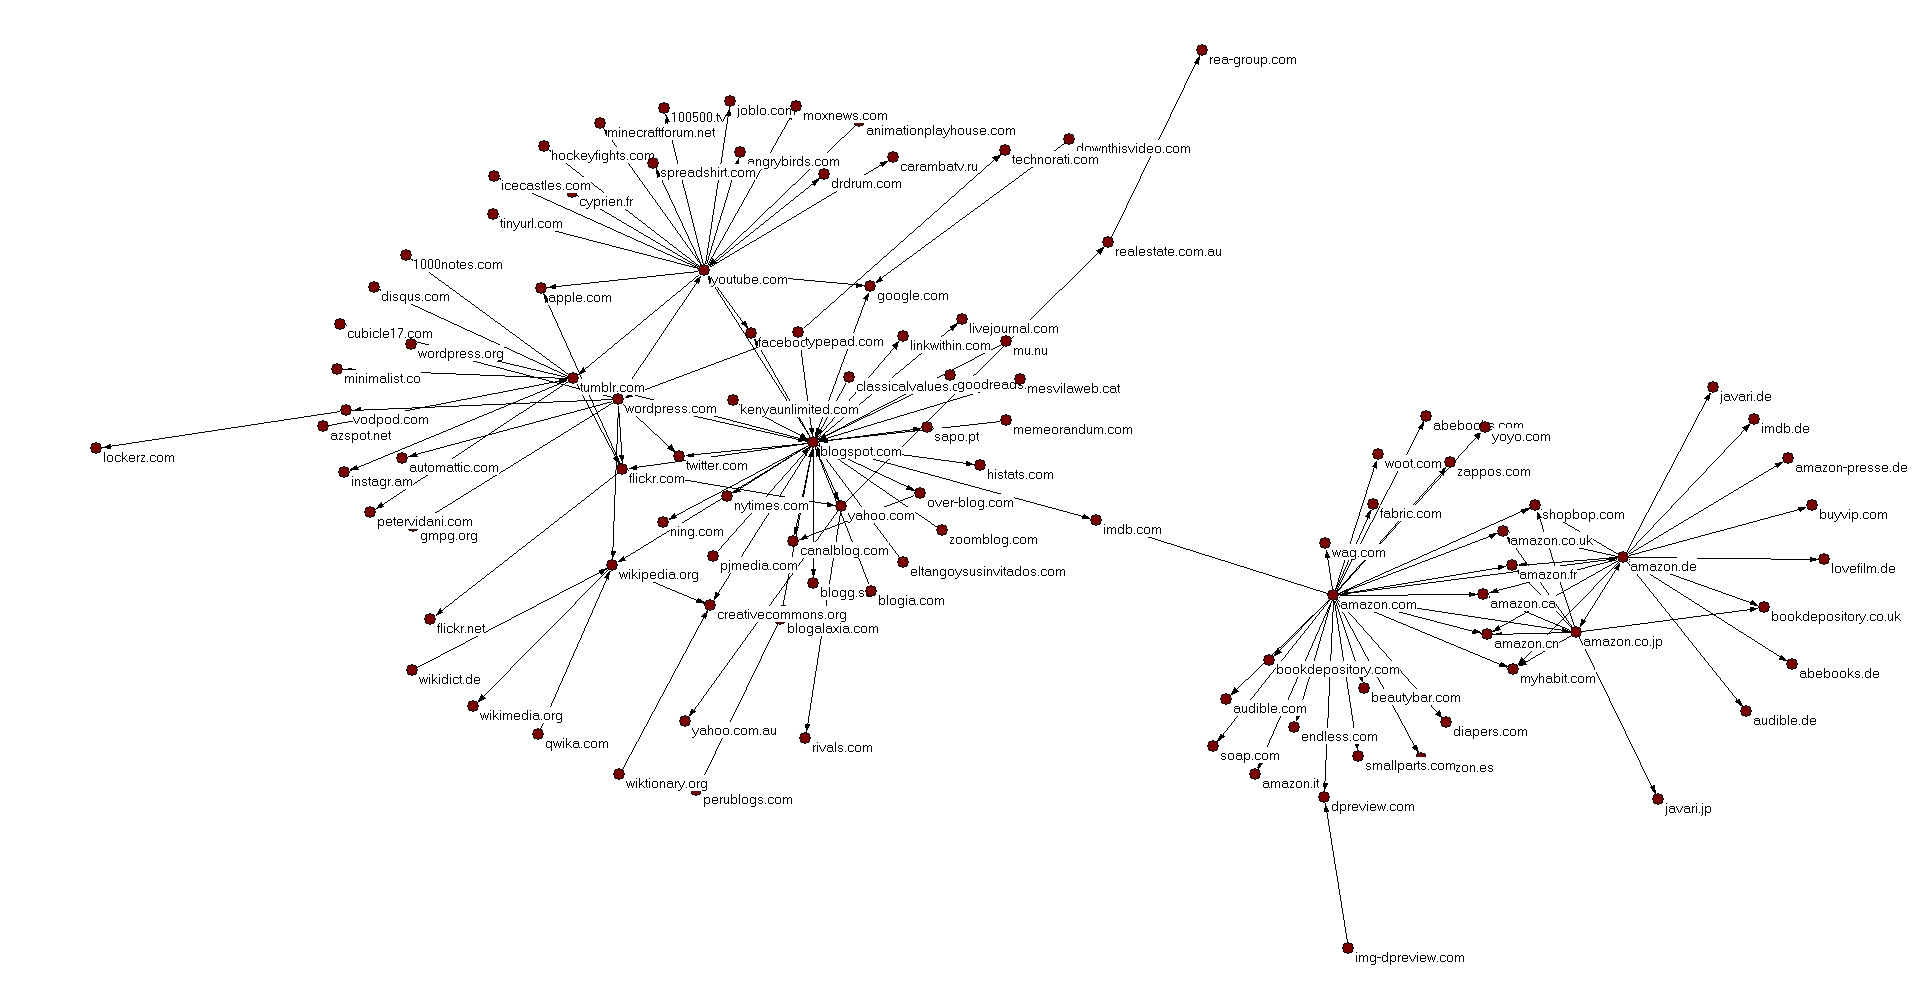
2.4 Frequently Interlinked PLDs
We also identified weakly connected components (WCC) of frequently interlinked websites. The picture below shows one WCC in which all websites are interlinked by at least 500,000 links connecting individual pages of both websites.
2.5 PLDs ranked by In- and Out-Degree
The following table shows the pay-level-domains with the highest in- and out-degree.
| Rank | PLD | out-degree |
|---|---|---|
| 1 | blogspot.com | 3,898,561 |
| 2 | wordpress.com | 2,249,553 |
| 3 | youtube.com | 1,078,938 |
| 4 | wikipedia.org | 862,705 |
| 5 | serebella.com | 699,609 |
| 6 | refertus.info | 668,271 |
| 7 | top20directory.com | 650,884 |
| 8 | typepad.com | 551,360 |
| 9 | botw.org | 496,645 |
| 10 | tumblr.com | 496,045 |
| 11 | dmoz.org | 476,890 |
| 12 | vindhetviahier.nl | 424,646 |
| 13 | jcsearch.com | 423,918 |
| 14 | startpagina.nl | 392,543 |
| 15 | yahoo.com | 371,087 |
| 16 | tatu.us | 370,918 |
| 17 | freeseek.org | 362,310 |
| 18 | lap.hu | 352,668 |
| 19 | blau-webkatalog.com | 312,924 |
| 20 | allepaginas.nl | 276,578 |
| PLD | in-degree |
|---|---|
| wordpress.org | 1,822,440 |
| youtube.com | 1,319,548 |
| wikipedia.org | 1,243,291 |
| gmpg.org | 1,156,727 |
| blogspot.com | 1,034,450 |
| google.com | 782,660 |
| wordpress.com | 710,590 |
| twitter.com | 646,239 |
| yahoo.com | 554,251 |
| flickr.com | 339,231 |
| facebook.com | 314,051 |
| apple.com | 312,396 |
| miibeian.gov.cn | 289,605 |
| vimeo.com | 269,003 |
| tumblr.com | 226,596 |
| joomla.org | 201,863 |
| amazon.com | 196,690 |
| w3.org | 196,507 |
| nytimes.com | 193,907 |
| sourceforge.net | 189,663 |
2.6 Top-Level-Domain Distribution
The following table shows the distribution of top-level-domains in our PLD Graph. The third column of the table compares the ranking of the PLDs with the ranking published in the Verisign Domain Name Industry Brief from the same time when the crawl was gathered. According to the Verisign statistics, our PLD Graph contains 18% of all registered pay-level-domains.
| TLD | PLDs | Percent | Rank | Verisign Rank |
|---|---|---|---|---|
| com | 21,205,742 | 49.44% | 1 | 1 |
| de | 2,994,885 | 6.98% | 2 | 2 |
| net | 2,321,230 | 5,41% | 3 | 3 |
| org | 2,194,525 | 5.12% | 4 | 6 |
| co.uk | 1,547,132 | 3.61% | 5 | 5 |
| nl | 1,017,387 | 2.37% | 6 | 8 |
| ru | 724,943 | 1.69% | 7 | 9 |
| info | 697,814 | 1.63% | 8 | 7 |
| it | 646,139 | 1.51% | 9 | - |
| com.br | 524,610 | 1.22% | 10 | - |
| others | 9,015,393 | 21.02% | - | - |
2.7 Linkage of Websites grouped by TLD
Beside the general connectivity of the different pay-level-domains we analysed the connectivity of pay-level-domains
between the different top-level-domains they belong to.
The figure below shows the hyperlinks of the pay-level-domains aggregated by their top-level-domain of the 10 largest TLDs.
All remaining domains are collected in the group named "others".
In this diagram, the outermost circle labelled with percentages represents the total number of links for each group.
Directly adjacent to this circle are two smaller bars for each group. The outer bar represents the number of in-links while the inner bar represents the number of out-links.
Further to the centre there is another circle labelled with absolute numbers.
This circle, again, represents the total number of links.
From this circle ribbons spanning through the middle represent interconnections between the different groups.
Incoming links have a white gap between the ribbon spanning in the middle and the circle part labelled with absolute numbers.
Also, the ribbon has the same colour as the group that it originates from.
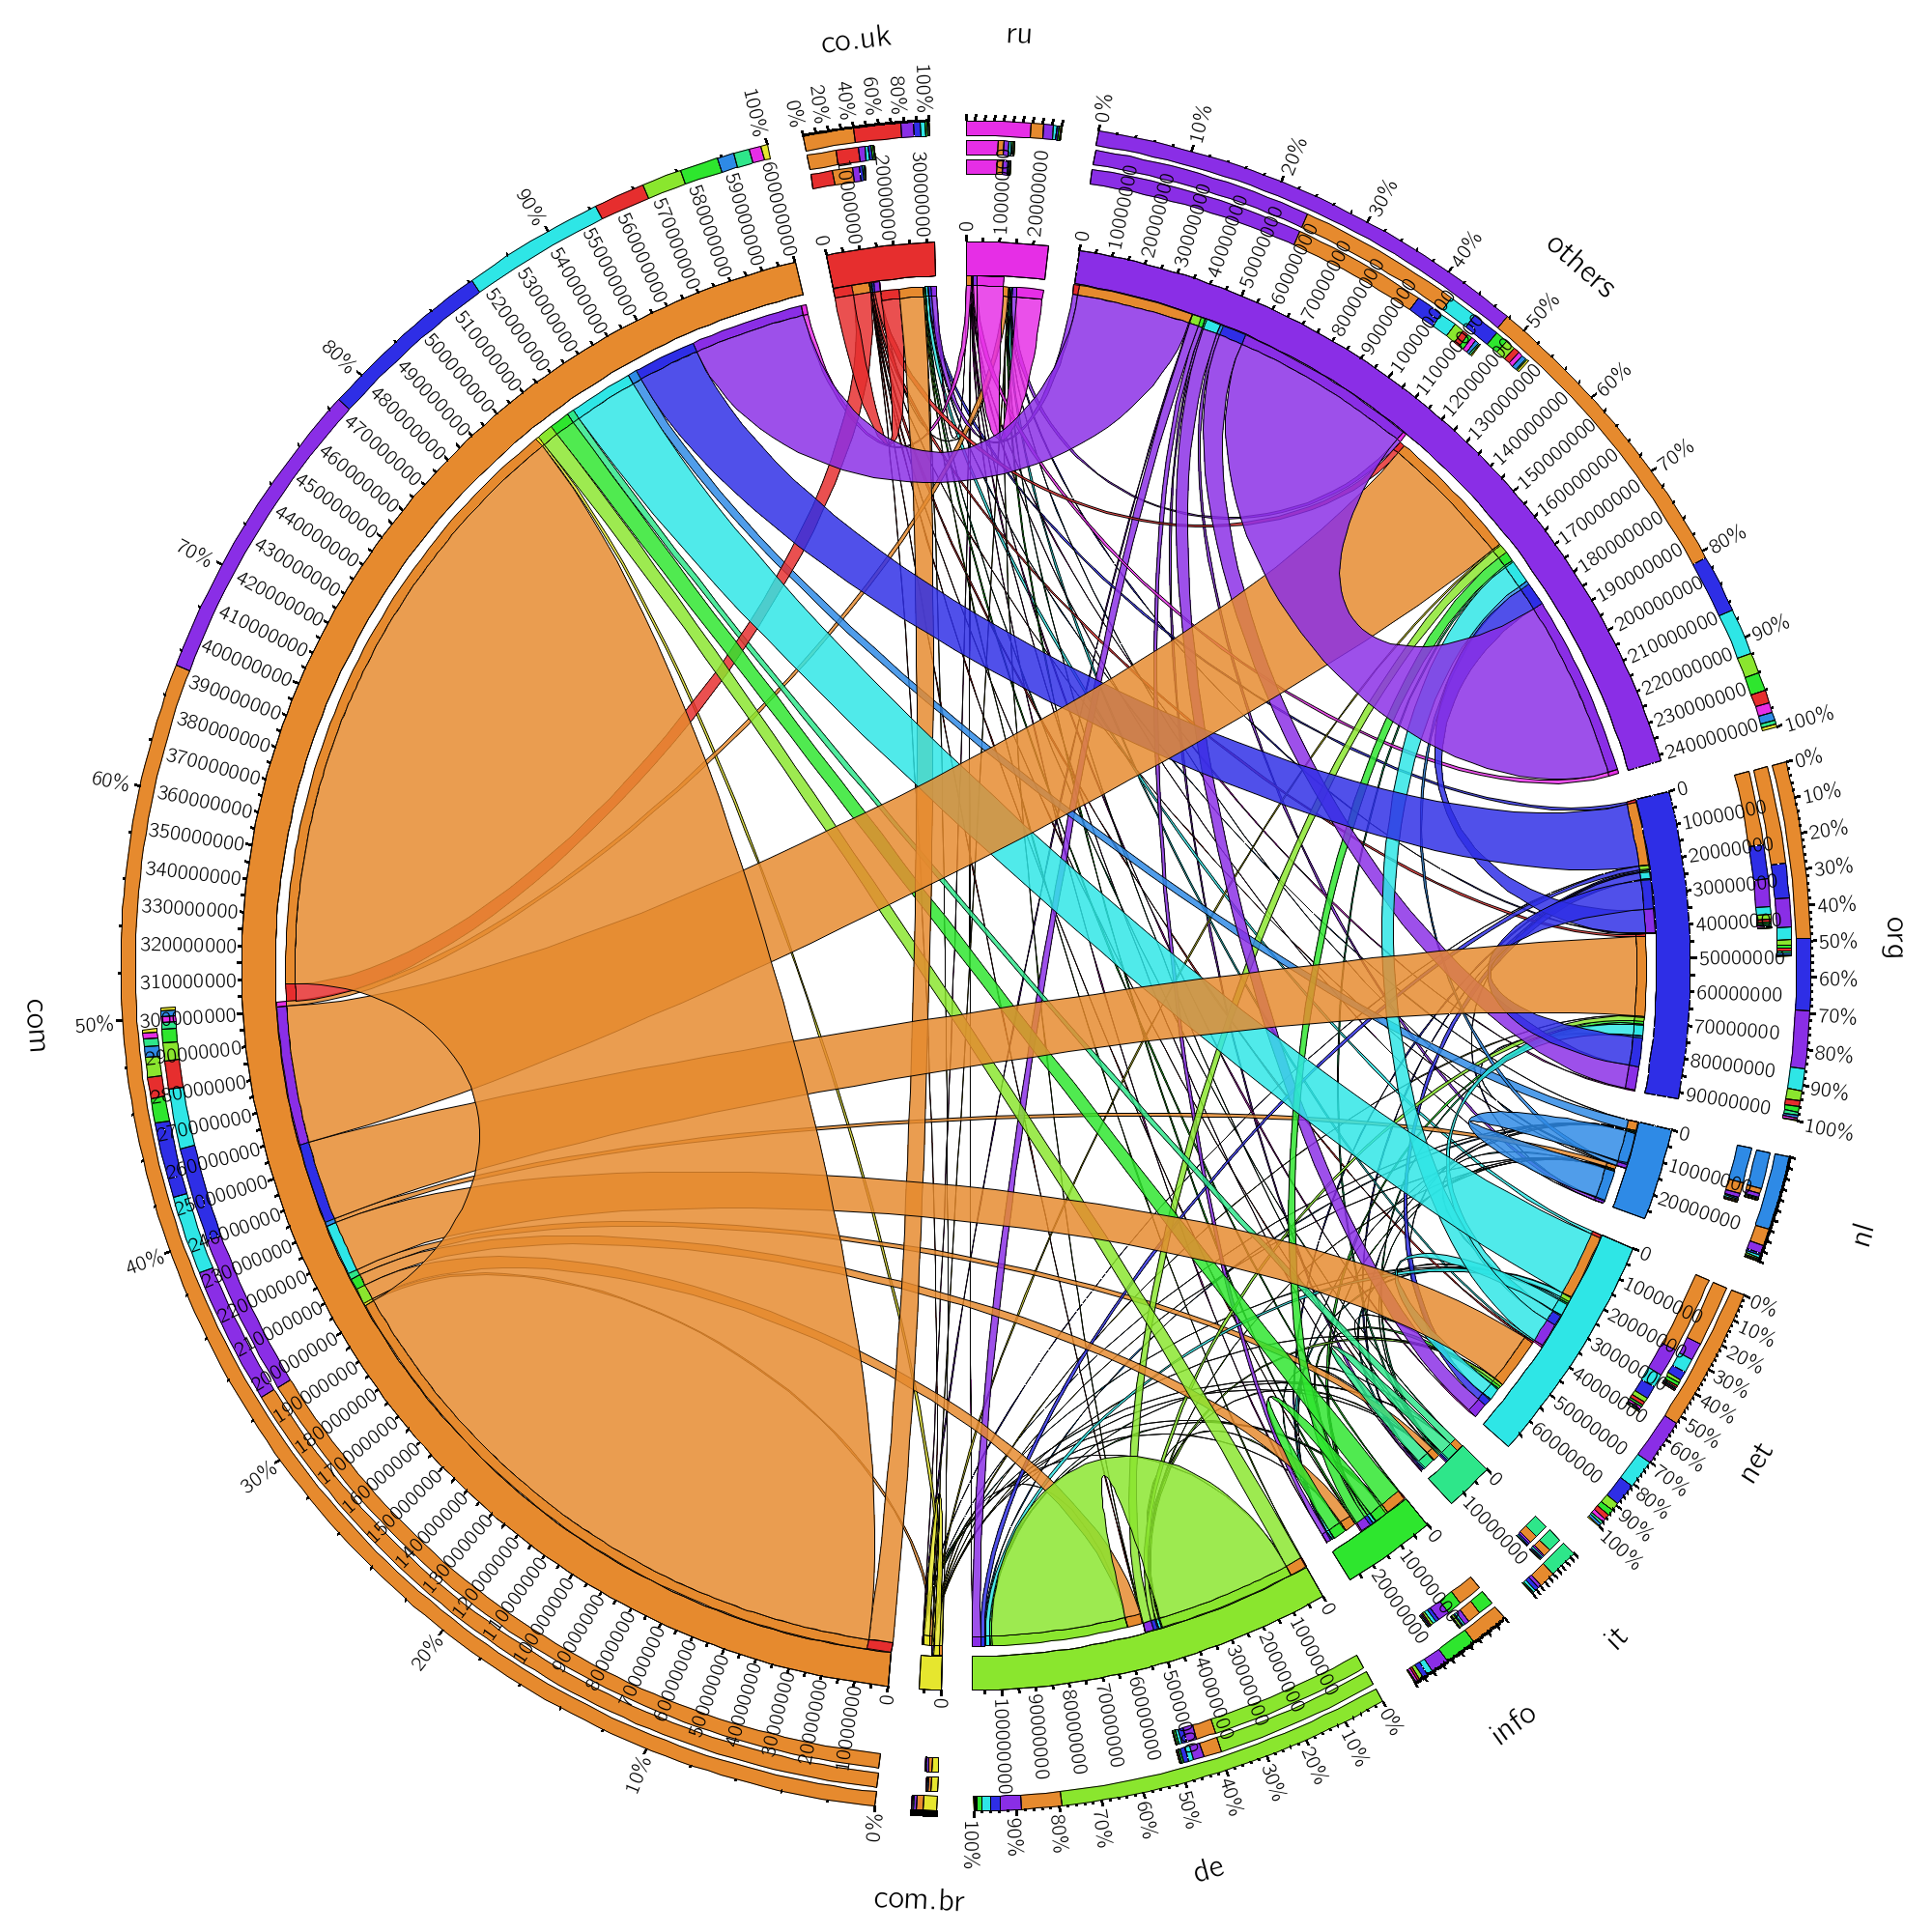
For the two largest groups of websites, ".com" and ".de" we find that the percentage of intra-TLD links is outstandingly high.
These domains tend to strongly link within their top-level-domain.
The opposite we find for the ".org"- and ".net"-TLDs.
Both only have a small fraction of intra-TLD-links compared to inter-TLD-links.
3. Code used for the Analysis
The source code that we used to generate the statistics presented above can also be downloaded from our Subversion repository.
4. Credits
Lots of thanks to
- the Common Crawl project for providing their great web crawl and thus enabling the creation of the WDC Hyperlink Graph.
- Sebastiano Vigna for providing and supporting us with his amazing Java WebGraph library.
- Andrej Mrvar for his fast and detailed answers about the usage of specific function in Pajek.
The creation of the WDC Hyperlink Graph was supported by the EU research project PlanetData and by Amazon Web Services through a Machine Learning Research Grant. We thank your sponsors a lot for supporting Web Data Commons.